Beta is a measure of the systematic risk involved with a stock or other investment. It can tell investors how much a stock tends to move with overall market forces, and can be a valuable tool in managing volatility in a portfolio. In this article, we’ll take a look at what beta is, how it can be useful, and some examples of beta in real-world stocks.
What is it?
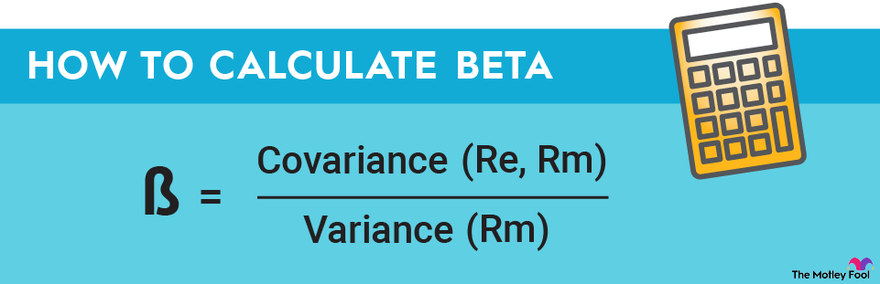
What is beta?
In a nutshell, beta is a measure of how reactive a stock is to overall market movements – particularly those of the S&P 500 benchmark index.
Obviously, stocks move individually, and for a variety of reasons. For example, if a company issues a strong earnings report, it can move up on a day when the overall market is down. But beta just tells us how reactive a stock tends to be when it comes to overall market forces. Here’s a quick reference guide to interpreting a stock’s beta coefficient.
Correlation Coefficient
- A beta coefficient of 1 means that a stock tends to move with the overall market.
- A beta coefficient of less than 1 means that a stock tends to be less volatile than the overall market. Utility and real estate stocks are two examples of industries that typically have low betas.
- A beta coefficient of more than 1 means that a stock tends to be more volatile than the overall market. High betas are quite common in the technology sector and among earlier-stage growth stocks.
- A negative beta coefficient indicates a stock’s movement tends to move in the opposite direction of the S&P 500. This is most common with inverse ETFs or investments that are specifically designed to move in the opposite direction of the overall market.
Why is it important?
Why is beta important for investors?
Beta is a way to quantify a stock’s systematic risk. In simple terms, systematic risk refers to investment risk related to the movement of the entire market. Beta can help you answer questions like, “If the S&P 500 declined by 10%, what would it mean for my portfolio?”
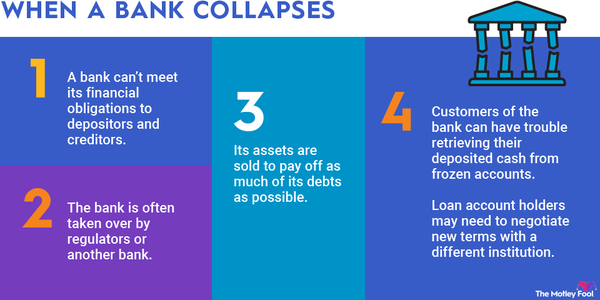
This is in contrast to unsystematic risk, which is the risk of investing in a particular company or industry. For example, beta does little to predict what a stock will do if it faces industry headwinds. It also doesn’t predict how stocks will react to their own news, such as earnings reports. For example, financial sector stocks have been hit harder than most in the recent market downturn because of fears about a recession, and beta does nothing to predict price movements in situations like this.
How it's used?
How should investors use beta?
Beta can play a big role in portfolio construction and volatility expectations. For example, you can calculate the weighted average beta of the stocks in your portfolio to get a sense of how volatile you can expect your investments to be on a day-to-day basis.
Furthermore, beta can help you determine how much risk and volatility a particular stock will add to your portfolio. If you want to mitigate the swings in your portfolio, you can choose to focus on investing in low-beta stocks. Conversely, if you have a higher risk tolerance and want the possibility of higher gains, some strong high-beta stocks could be what you need.
Examples
Examples of beta
Here are just a few examples of how beta is used in the real world:
- Apple (AAPL 0.53%) has a beta of 1.3, implying that it is more volatile than the overall market, but not by much. If the S&P 500 increased by 1%, it would be reasonable to expect Apple to rise by 1.3%.
- Real estate investment trust, or REIT, Realty Income (O -0.09%) has a beta of 0.8, indicating that it is significantly less volatile than the S&P 500. So, if you’re looking to lower the overall volatility in your portfolio, a stock like this could be a good choice.
- Tesla (TSLA 0.04%) has a beta of 2.0, indicating that it is twice as reactive as the overall stock market. So, on a day when the S&P 500 drops by 3%, it would be reasonable to expect Tesla to drop by 6%.