Over the next four years, analysts expects Meta's earnings per share to grow by 41%, or a compound annual growth rate of 9%. Since 15.7 divided by 9 is 1.74, Meta's PEG ratio is currently 1.74.
If you're wondering if that's a good PEG ratio, you'd want to compare to its peers. Currently, the S&P 500 has a PEG ratio of 1.56, and the communications services sector to which Meta belongs has a PEG of just 1.12. That sector may not be the best comparison, however, since it includes slow-growing companies such as Verizon (VZ +1.37%) and AT&T (T +0.49%). Alphabet (GOOGL -0.23%)(GOOG -0.48%), which may be Meta's closest peer, trades at a PEG of 2.09, making Meta look cheap by comparison.
What does the PEG ratio tell you?
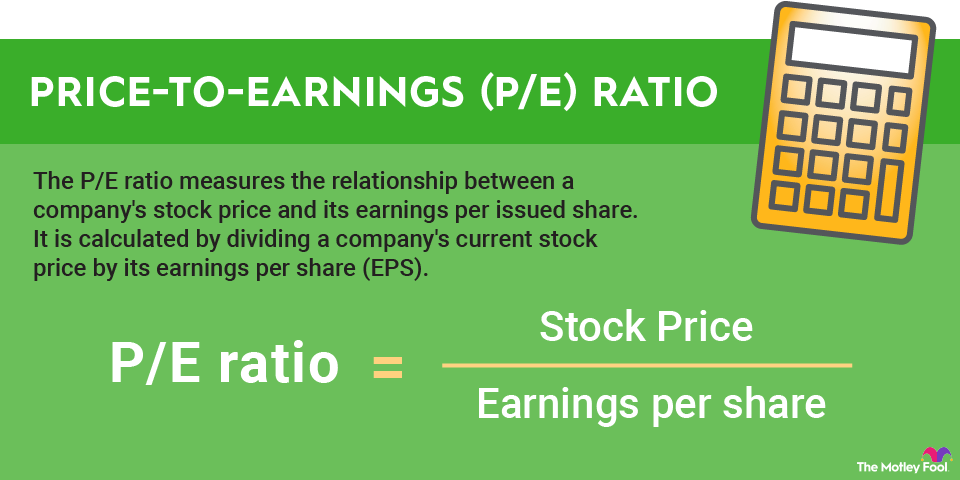
The PEG ratio tells you how expensive a stock is relative to its growth rate. The price-to-earnings ratio is the most widely ratio used by investors, but the PEG has a key advantage over the PE ratio in that it adjusts the P/E for growth. Typically, higher P/E ratios signal faster growth rates, but the PEG allows investors to compare stocks with high and low P/E ratios based on their growth rates.
The PEG ratio also offers a simple way for investors to see how cheap a stock is relative to its growth rate. All things being equal, a lower PEG ratio is better.
Traditionally, a PEG ratio of 1 was considered fairly valued, with less than 1 being undervalued and more than 1 being overvalued. Over the past decade, however, price-to-earnings valuations have become stretched because of the rise of the tech sector, which tends to trade at a higher valuation than mature sectors such as energy or tobacco. Because of that shift, you're unlikely to see many stocks with PEG ratios of less than 1 these days since many of the priciest stocks on the market, especially in sectors such as cloud computing, don't even have profits.
Famous fund manager Peter Lynch helped popularize the PEG metric, arguing in his book One Up on Wall Street that 1 was a fair PEG ratio since he believed the rate of growth should approximate the price of the stock.
A PEG ratio of less than 1, assuming the growth forecast is accurate, is a good indicator that a stock will outperform over the next few years.
Advantages and disadvantages of the PEG ratio
There are a number of benefits to using the PEG ratio. The biggest advantage is that it factors in a company's growth rate, making it more convenient than the P/E ratio, which requires investors to do the growth comparison on their own. With the P/E, investors may choose to use a company's P/E ratio based on a future year's earnings, i.e., a forward P/E. Unlike most ratios, the PEG is also forward-looking, making it a true reflection of a stock's expected profits rather than its trailing performance.
However, the PEG can be more difficult to use because growth rates aren't always available or accurate. If a company trades at a low PEG ratio, it could be because the market doesn't believe the growth forecast. Additionally, since the number of years in the PEG ratio can vary, apples-to-apples comparisons can be difficult. In the example of Meta, analysts expect earnings per share to decline this year, which means it wouldn't even have a PEG ratio if we were just using a one-year forecast. By contrast, over the next three years, the PEG ratio would be just 0.86, much lower than the current 1.74.
It's worth remembering that earnings forecasts are less accurate over a longer time, so next year's earnings consensus should be closer to actual earnings than the five-year forecast.
Like other ratios valuation metrics, it's a good idea to use the PEG ratio along with other tools. Investors should also consider the balance sheet, debt burden, and cash flow, which aren't reflected in the PEG ratio or other valuation metrics that use the income statement.
Related investing topics