The price-to-earnings ratio, also known as the P/E ratio, is one of the most commonly used stock valuation metrics, and it is important for any investor to understand. In this article, we’ll take a closer look at what the P/E ratio is, how to calculate it, and how to use it as part of your investment analysis.
Understanding the P/E ratio
Understanding the P/E ratio
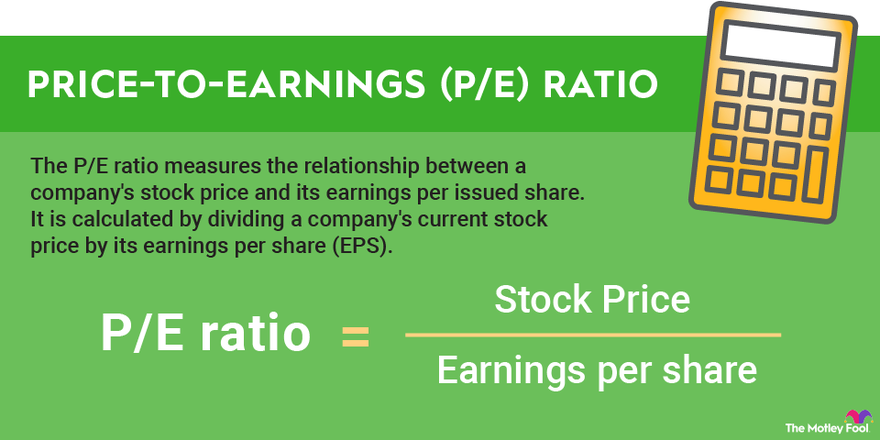
The P/E ratio, or price-to-earnings ratio, is a metric that compares a company’s net income to its stock price. It can be an excellent tool when analyzing stocks and can help investors get a sense of whether a stock is a good value or expensive.
As the name implies, the P/E ratio is calculated by taking the current share price of a stock and dividing by its earnings per share over a one-year period. For example, if a stock trades for $40 per share and earned $2 per share in the past year, its P/E ratio would be 20.
You may hear the P/E ratio also referred to as the P/E multiple or earnings multiple, and it’s important to realize that these terms are often used interchangeably and mean the same thing.
There are several different ways to calculate the P/E ratio, with the two most common being the trailing P/E and the forward P/E. A stock’s trailing P/E is calculated by using its past four quarters’ earnings, while the forward P/E is calculated by using the consensus projections, or the company’s own guidance, for the next 12 months of earnings.
Why is P/E ratio important?
Why is the P/E ratio important?
The P/E ratio is important because it is a valuation metric that is useful for comparing different investment opportunities to one another. It can be a useful tool when trying to identify undervalued stocks, and it can help you avoid overpaying for stocks as well.
How to use the P/E ratio
How to use the P/E ratio
The most effective way to use the P/E ratio is to compare the valuations of businesses in the same industry at similar stages of maturity. For example, you might use the P/E ratio as part of an analysis comparing Target (TGT -1.32%), Costco (COST 0.47%), and Walmart (WMT 0.83%).
It is also worth pointing out that the P/E ratio doesn’t work on companies that aren’t profitable. There are other valuation metrics that can be applied to early-stage growth companies, but the P/E ratio isn’t one of them.
No valuation metric can tell you if a stock is an attractive investment opportunity all by itself, and the P/E ratio is no exception. For example, the stock of a faster-growing business should have a higher P/E ratio than a slower-growing one, all other factors being equal. So the P/E ratio is best used as one piece of the puzzle, in combination with earnings growth, cash and debt levels, gross and net profit margins, and other figures.
Finally, if a stock has a P/E ratio that is much lower than its peers, it can be a red flag that is worthy of further investigation. Companies with P/E ratios that seem too good to be true often have declining sales, poor balance sheet quality, or another underlying reason for the seemingly cheap valuation.
Example of using the P/E ratio
Example of using the P/E ratio
Let’s take a look at a real-world example of calculating the P/E ratio. As of Feb. 6, 2023, Apple (AAPL 0.53%) traded for $154.50. Over the past four quarters, Apple earned $5.90 per share. So we can calculate its trailing P/E ratio as follows:
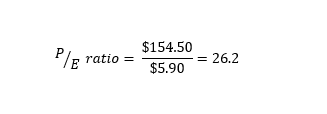
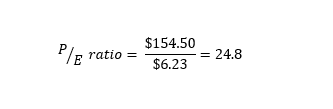
So Apple trades for 26.2 times its trailing-12-month earnings. If we wanted a more forward-looking metric, we can use Apple’s projected earnings over the next 12 months, which are $6.23 per share. If we use this, our forward earnings calculation looks like:
Now let’s say that you’re trying to decide between Apple and Microsoft (MSFT 1.58%). On the same date, Microsoft traded for $255.12. Its trailing-12-month earnings were $8.99 per share, so its trailing P/E ratio could be calculated as:
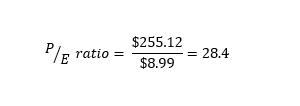
Apple’s trailing P/E is 26.2, while Microsoft’s is 28.4. Based on the P/E ratio alone, Apple appears to be the cheaper stock. However, as mentioned above, it’s important to understand the P/E ratio is just one metric that should be used in stock analysis and doesn’t tell the whole story.
So when conducting an analysis of two companies like this, the best practice is to use the P/E ratio along with other metrics for both companies to develop a thorough comparison of the two investment opportunities.